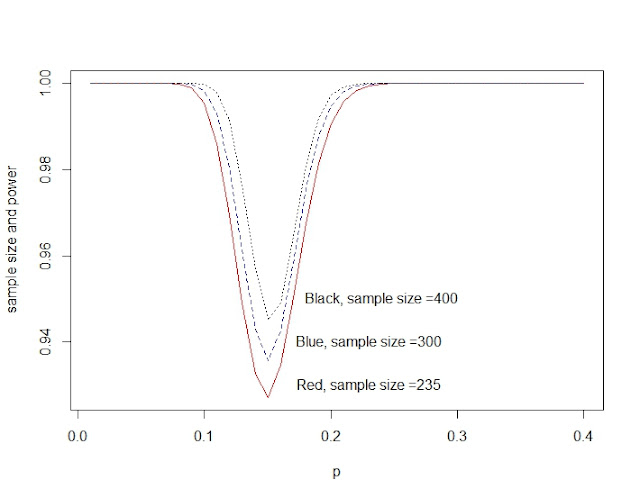
power_n<-function(size){
p0<-51/235 #for calculate the critical region
c<-qbinom(p0,size, 1/6)
p<-seq(0.01,0.4,0.01)
pow<-1-dbinom(c,size,p)+dbinom(size-c,size,p) #the second part is very small can be omitted.
return(pow)
}
p<-seq(0.01,0.4,0.01)
plot(p,power_n(235),type="l",col="red")
lines(p,power_n(300),lty=2,col="blue")
lines(p,power_n(400),lty=3, col="black")
text(0.23,0.93,"Red, sample size =235")
text(0.23,0.94,"Blue, sample size =300")
text(0.24,0.95,"Black, sample size =400")
